Your MVP Is Live. Now What? The 5 Metrics That Actually Matter
You built it. You shipped it. People are signing up. Now you're staring at your analytics dashboard, drowning in numbers. Page views, bounce rates, session duration. Which ones actually tell you if this thing is working? Eric Ries built the Lean Startup around one loop: build, measure, learn. But that middle part, measure, trips up nearly everyone.
Kobi Levi
Here's the truth: most metrics are vanity metrics. They make you feel good but don't help you make decisions. Total users go up, you feel smart. They go down, you blame external factors.
Actionable metrics show clear cause and effect. Change something, the metric moves predictably. These tell you what to do next.
Here are the five metrics that predict whether you'll have a business in six months.
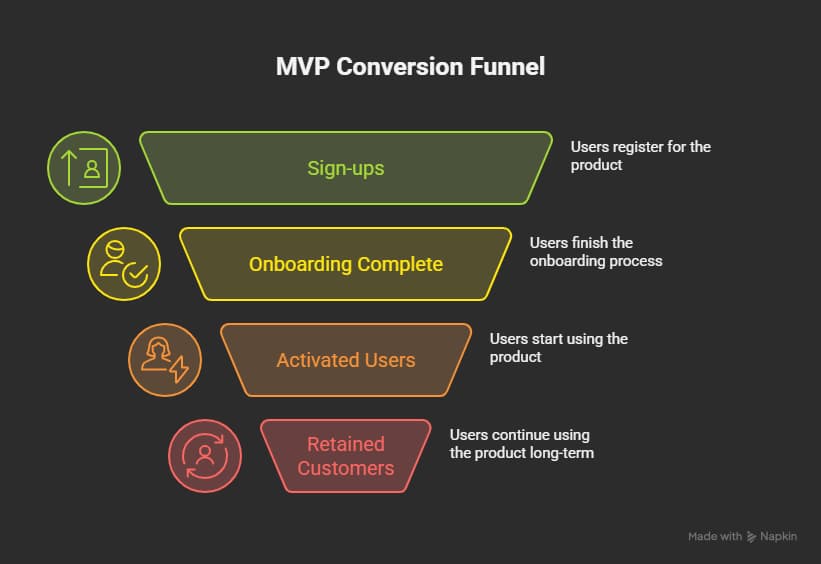
The Funnel That Matters
Your MVP is a series of doors. Each door is where users decide: "Is this worth my time?"
Door 1: Landing Page → Start Sign-up
Door 2: Start Sign-up → Complete Onboarding
Door 3: Complete Onboarding → Active User
Door 4: Active User → Paying Customer
Door 5: Paying Customer → Retained Customer
Each door has a conversion rate. Multiply them together and you get your true success rate: what percentage of visitors become retained customers?
That number tells you if you have a business.
Metric 1: Landing Page to Sign-up
What it measures: Are you attracting the right people?
Benchmark: 3-5% typical, 10%+ excellent
Low conversion here means wrong audience or wrong message. If you're getting traffic but nobody's signing up, you might be attracting browsers instead of people with the problem you solve.
Quick wins:
Make your value proposition stupid-simple (3-second test)
Use interactive demos (25-40% engagement vs 3-5% sign-ups)
Let users experience value before creating an account
Metric 2: Sign-up to Onboarding Completion
What it measures: Is your onboarding too complicated?
Benchmark: 20% decent, 25-34% average
Someone clicked "Sign Up." Did they finish? Every field you ask them to fill, every step. it's all friction. Friction kills momentum.
Quick wins:
Cut onboarding to 3 screens max (3-step tours: 72% completion, 7-step: 16%)
Delete optional fields
Show progress so users know they're almost done
Auto-fill when users return
Metric 3: Onboarding to Active User (The "Aha Moment")
What it measures: Do users experience value fast enough to keep using it?
Benchmark: 30% baseline
This is your most critical metric. The "aha moment" is when a user goes from "I'll try this" to "This solves my problem."
Here's why it matters: A 25% increase in activation yields a 34% lift in MRR after 12 months. Activation has the biggest revenue impact of any metric.
Finding YOUR aha moment: Analyze your power users. What did they do in week one that everyone else didn't?
Slack: Team sends 2,000 messages
Pinterest: User saves pins weekly for 4 weeks
Landing page builder: Click "Publish" and see a live page without code
Quick wins:
Get users to value faster, remove unnecessary steps
Don't gate value behind account creation if possible
Use checklists to guide users
Focus on your most valuable features, not every feature
If users complete onboarding but don't return, they didn't experience enough value.
Metric 4: Active User to Paying Customer
What it measures: Does free convert to revenue?
Benchmark: 10-25% for B2B SaaS
Revenue proves people value your product enough to pay. This differs from activation, initial payment reflects marketing effectiveness, while repeat purchases prove product value.
Stuck on your AI-built app, or chasing your first customers?
One team gets you unstuck, then gets you paying users.
Quick wins:
Make sure users hit their aha moment before trial ends
Use contextual upgrade prompts when they try premium features
Target trial users who haven't activated yet
High activation but low payment = pricing problem or value perception issue.
Metric 5: Retention (The Only Metric That Really Matters)
What it measures: Do users come back?
Everything before retention is setup. Retention proves your product's value. Repeat usage validates that users keep finding value.
What "good" looks like:
Track retention by cohort at Day 1, Day 7, Day 30. You want the curve to flatten—if 30% are still active after 30 days and that stabilizes, that's your retained base.
Different products need different tracking:
Daily use (social, productivity): D1, D7, D30
Weekly use (project management): W1, W4, W12
Monthly use (finance, reporting): M1, M3, M6
Quick wins:
Interview power users to understand why they come back
Build habit loops: trigger → action → reward
Re-engage users inactive for 7-14 days
Add features users need repeatedly, not just once
Continuously declining retention = product-market fit problem.
The Multiplication Problem
These metrics aren't independent. They multiply.
Example:
10% landing → sign-up
50% sign-up → onboarding
30% onboarding → activated
40% activated → paying
60% retained after 3 months
Your true success rate: 10% × 50% × 30% × 40% × 60% = 0.36%
Out of 1,000 visitors, you get 3-4 retained, paying customers.
Why this matters:
Small improvements compound. Boost each stage 25% and you get 200%+ more customers
Your weakest link strangles the entire funnel
You can't optimize everything at once—find your biggest leak and fix that first
Your Action Plan
Most founders react to whatever number looks bad that day, hopping between problems without solving any.
Here's what to do instead:
Week 1: Set up tracking
Define your five conversion points
Use Mixpanel, Amplitude, or Google Analytics
Create a simple dashboard you'll actually check
Week 2-3: Get your baseline
Measure for two weeks before changing anything
Identify which stage has the biggest drop-off
Week 4+: Fix one thing
Pick your biggest bottleneck
Form a hypothesis about why users drop off
Run one experiment
Measure results
Repeat
Perfect metrics don't exist in month one. But if after three months of focused effort none of your metrics improve, that's your signal to pivot.
The Real Question
All five metrics answer one question: Are you building something people actually want to use?
Not "like the idea of." Not "think is cool." Actually use. Repeatedly. Willingly.
If all five metrics are strong, you're heading toward product-market fit. If even one is broken, you've found your next problem to solve.
That's the difference between guessing and building a real business.
Need help interpreting your MVP metrics? I help early-stage founders turn data into decisions. Book a consultation to review your metrics and create an action plan that moves the needle.
Stuck on your build, or ready for your first customers?
One team takes your AI-built app from broken to working, then to paying users.
Get Unstuck
We rebuild your stalled app into a working MVP.
Get Your First Customers
Brand, funnel, and traffic until real users show up.
30+ startups reviewed · 20 years in tech · Now accepting 3-4 new clients